Half of a Half
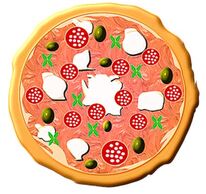
Here is a picture of a pizza. This picture shows a whole pizza. The whole pizza is 100% of a pizza.
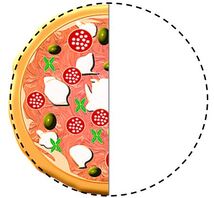
If someone ate half of the pizza, then half of the pizza would be left. Half of the pizza is 50% of the pizza.
What do you think would be left if someone ate half of the half pizza above? What fraction of a pizza would that be? What percent of a pizza would that be? Before you keep reading, try drawing a picture of what you think this might look like.
Ready to see a picture?
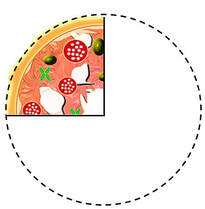
Here is a picture of what it might look like if someone ate half of the pizza that was left. Can you see what fraction of a pizza it is? Can you see what percent it is? (If you're not sure, keep reading!)
Ready to see a picture?
Here is a picture of what it might look like if someone ate half of the pizza that was left. Can you see what fraction of a pizza it is? Can you see what percent it is? (If you're not sure, keep reading!)
Here is another picture of the same part of the pizza, but with some extra lines drawn in to help you see the fraction.
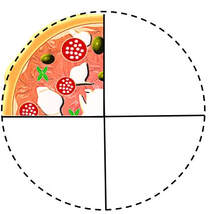

This picture shows that the part of the pizza that is left is one out of four equal pieces. As a fraction, that is called one-fourth. It also is sometimes called one quarter.
As a fraction, one-fourth looks like this: It can also be written as 1/4 |
Because 1/4 is half of a half, the percent for 1/4 is half of 50%. Half of 50% is 25% so 1/4 means the same thing as 25%.
Just like there are many ways to write the fraction 1/2, there are many ways to write the fraction 1/4. The interactive model below shows a rectangle that has 1/4 or 25% colored orange. You can tell that it is 1/4 because it is 1 of 4 pieces that are all the same size. You can drag the orange dot to find some other ways of saying 1/4. Play with it and see if you can find a pattern. Don't forget that the numbers in the boxes show you the sizes of the boxes and that you can also look at the number line to see parts and wholes!
Just like there are many ways to write the fraction 1/2, there are many ways to write the fraction 1/4. The interactive model below shows a rectangle that has 1/4 or 25% colored orange. You can tell that it is 1/4 because it is 1 of 4 pieces that are all the same size. You can drag the orange dot to find some other ways of saying 1/4. Play with it and see if you can find a pattern. Don't forget that the numbers in the boxes show you the sizes of the boxes and that you can also look at the number line to see parts and wholes!
Here are some more fractions that are equal to 1/4 or 25%. Do they fit your pattern?
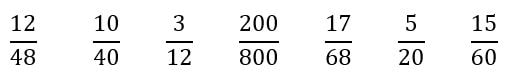
Try writing some other fractions that equal 25%. What has to be true about a fraction for it to equal 25%?
(After you have tried writing some of your own, you can click here for some more examples.)
(After you have tried writing some of your own, you can click here for some more examples.)
More About 25%
You explored the idea of 50% on the previous web page. Before exploring 25% further, here are some important ideas about 50% that are worth reviewing:
Now, use the model below to explore what 25% looks like. You can drag the dots to change 25% and 100% (the whole). The numbers below the number line show you the values of 25% and 100%. Here are some questions to think about as you play with the model:
How is 25% related to 50%? How is it related to 100%? (You'll explore this more below.)
What percent do you think the question mark stands for?
- 50% of a number is the same as half (1/2) of that number.
- If two people share something fairly, each person gets 50%.
- If one person gets more than 50%, then the other person will get less than 50%.
- 50% of 100 is 50.
- 50% of $1.00 is 50 cents, or $0.50.
Now, use the model below to explore what 25% looks like. You can drag the dots to change 25% and 100% (the whole). The numbers below the number line show you the values of 25% and 100%. Here are some questions to think about as you play with the model:
How is 25% related to 50%? How is it related to 100%? (You'll explore this more below.)
What percent do you think the question mark stands for?
Use the model to answer these questions:
1. What is 25% of 120?
2. What is the whole if 45 is 25%?
3. If 50% of a number is 80, what is 25% of that same number?
4. If 25% of a number is more than 35, what could the number be?
Click here if you want to check your answers.
1. What is 25% of 120?
2. What is the whole if 45 is 25%?
3. If 50% of a number is 80, what is 25% of that same number?
4. If 25% of a number is more than 35, what could the number be?
Click here if you want to check your answers.
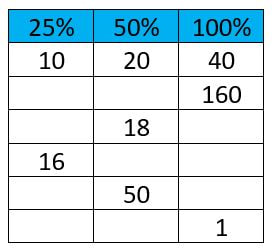
5. How is 25% related to 50% and to 100%? Try filling in this table to find out (the first one is done for you):
What do you notice about the filled in table?
Click here to see the filled in table and some things you might have noticed.
6. Think about how you might find 25% of a number.
For each strategy, decide whether or not you think it will work and then check it with some numbers (you can make up your own number and check with the model, or pick a number from the table).
- To find 25% of a number, find half of it and then find half of that.
- To find 25% of a number, multiply it by 25.
- To find 25% of a number, divide it by 4.
- To find 25% of a number, divide it by 2 and then divide it by 2 again.
- To find 25% of a number, divide it by 25.
When you are ready, click here for the answers.
If you think you know another way of finding 25%, check it with some numbers from the table to see if it works!
Did you figure out what percent the question mark (?) in the model stands for? If not, don't worry. You'll learn more about that on the next web page.
A Survey About Reading - Looking at 25%
Several towns were surveyed to see whether people preferred reading on paper or on a device like a phone or e-reader. Look at the table below.
7. Which towns had more than 25% of the people saying that they preferred paper? How do you know? (You can use the model above to help you think about this.)
8. Which towns had less than 25% of the people saying that they preferred paper? How do you know?
7. Which towns had more than 25% of the people saying that they preferred paper? How do you know? (You can use the model above to help you think about this.)
8. Which towns had less than 25% of the people saying that they preferred paper? How do you know?
| Survey Results | |||
|---|---|---|---|
| Town | People surveyed | People who prefer paper | People who prefer a device |
| Springfield | 100 | 40 | 60 |
| Chester | 120 | 95 | 25 |
| Greenville | 65 | 15 | 50 |
| Arlington | 75 | 40 | 35 |
In Springfield, 40 out of 100 people surveyed said they prefer reading on paper, so the fraction of people who said they prefer paper was 40 out of 100 or 40/100.
9. Is this fraction more or less than 25%? How do you know?
10. Try writing fractions for the people who preferred paper in the other towns. Are those fractions more or less than 25%?
(If you want to check your work, click here for the answers.)
Here's some information about some other towns where the survey was conducted. The questions have more than one possible answer. Make sure you know why each answer works!
11. In Hudson, more than 25% of the people said they preferred reading on paper. If 80 people were
surveyed in Hudson, what is a possible number for the people who said they prefer paper?
12. In Ashland, 48 people said that they preferred reading on a device and this was more than 25% of the
people surveyed. How many people might have been surveyed in Ashland?
13. In Dover, 30 people said they preferred reading on a device and this was less than 25% of the people
surveyed. How many people might have been surveyed in Dover?
Survey results are often shown in a circle graph. On the circle graph below, drag the slider to show what you think the survey results might look like from the different towns.
14. Try to make a graph that shows that exactly 25% of the people prefer paper. On that graph, what percent of the people prefer devices?
15. Can you make a graph that shows that more than 25% of the people prefer paper? If not, why not?
16. Can you make a graph that shows that less than 25% of the people prefer paper? If not, why not?
(Click here to see some example graphs.)
